![[Graphics:HTMLFiles/index_1.gif]](HTMLFiles/index_1.gif)
Copyright (c) 1995-2003, Junzo SATO. All rights reserved.
![[Graphics:HTMLFiles/index_1.gif]](HTMLFiles/index_1.gif)
![[Graphics:HTMLFiles/index_2.gif]](HTMLFiles/index_2.gif)
July 27th 2003
As the reader can see in the reference[1], constuction of the fractal surface is done with simple operations. Cutting the sphere randomly into two hemispheres and adding a random gaussian displacement in radial direction to one of hemispheres give the fractal planet after iterations.
Assuming that the sphere has an unit radius, the point on the surface is described as follows.
In[1]:=
![]()
Out[1]=
![]()
The size of the vector should be the unit length.
In[2]:=
![]()
Out[2]=
![]()
By introducing an angle η for x-y plane, the above expression is modified.
In[3]:=

Out[3]=
![]()
Out[4]=
![]()
Out[5]=
![]()
Then, the constraint becomes the following.
In[6]:=
![]()
Out[6]=
![]()
In[7]:=
![]()
Out[7]=
![]()
When we choose a point on the sphere, a great circle, i.e., the edge of the hemisphere is uniquely defined by regarding the specified point as elements of the normal vector of the circle's plane.
In[8]:=
![]()
Out[8]=
![]()
In[9]:=
![]()
Out[9]=
![]()
The normal vector itself should have unit length.
In[10]:=
![]()
Out[10]=
![]()
The constraint for the point ![]() is same as the previous one.
is same as the previous one.
In[11]:=
![]()
Out[11]=
![]()
Now we can achieve the great circle's coordinates by solving equations for λ and μ.
In[12]:=
![]()
Out[12]=
![{{μ -> (-nx Cos[η] - ny Sin[η])/(nz^2 + nx^2 Cos[η]^2 + ny^2 Sin[η ... ), λ -> -nz/(nz^2 + nx^2 Cos[η]^2 + ny^2 Sin[η]^2 + nx ny Sin[2 η])^(1/2)}}](HTMLFiles/index_25.gif)
The values λ and μ are determined by η. Let's define the module which returns a random point on the unit circle.
In[13]:=
![]()
This is useful to specify a random normal vector of a great circle.
In[14]:=
![]()
Out[14]=
![]()
For example, the first solution of μ with specified vector n becomes the following.
In[15]:=
![]()
Out[15]=
![]()
Because it is possible to represent λ and μ as sin(θ) and cos(θ) respectively, we have four plots of η versus θ curve.
In[16]:=
![Plot[cos^(-1)(s [[ 1, 1, 2 ]]) /. l, {η, 0, 2 π}, AxesLabel -> {"η&quo ... 2, 2 ]]) /. l, {η, 0, 2 π}, AxesLabel -> {"η", "θ"}]](HTMLFiles/index_31.gif)
![[Graphics:HTMLFiles/index_32.gif]](HTMLFiles/index_32.gif)
Out[16]=
![]()
![[Graphics:HTMLFiles/index_34.gif]](HTMLFiles/index_34.gif)
Out[17]=
![]()
![[Graphics:HTMLFiles/index_36.gif]](HTMLFiles/index_36.gif)
Out[18]=
![]()
![[Graphics:HTMLFiles/index_38.gif]](HTMLFiles/index_38.gif)
Out[19]=
![]()
![]()
In[20]:=
![]()
For the special case when the normal vector is along the cartesian ax, this function returns appropriate plots.
In[39]:=
![Plot[θ(1, 0, 0), {η, 0, 2 π}] Plot[Chop[θ(0, -1, 0)], {η, 0, 2 π}, PlotRange -> All] Plot[θ(0, 0, 1), {η, 0, 2 π}]](HTMLFiles/index_42.gif)
![[Graphics:HTMLFiles/index_43.gif]](HTMLFiles/index_43.gif)
Out[39]=
![]()
![[Graphics:HTMLFiles/index_45.gif]](HTMLFiles/index_45.gif)
Out[40]=
![]()
![[Graphics:HTMLFiles/index_47.gif]](HTMLFiles/index_47.gif)
Out[41]=
![]()
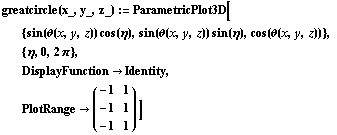
As the result of the above calculations, the greate circle is defined the following function.

![]()
![]()
![]()
![[Graphics:HTMLFiles/index_53.gif]](HTMLFiles/index_53.gif)
![]()
![]()
![[Graphics:HTMLFiles/index_56.gif]](HTMLFiles/index_56.gif)
![]()
The functions of the great circles are obtained.
![]()
Let's the counter k to 1.
![]()
For the k-th function of the great circle, we can get numbers which are rescaled from radian values to degrees.
![]()
![]()
![[Graphics:HTMLFiles/index_62.gif]](HTMLFiles/index_62.gif)
![]()
The matrix of the η - θ plane in degrees is allocated. The size is 360 times 180.
![]()
The package for the normal distribution is loaded.
![]()
Gaussian random number is created using NormalDistribution.
![]()
For the great circle, one of hemispheres is selected randomly. Then the gaussian random number is added to the value of the selected hemisphere.
![newcut[nl_] := Module[{g = gauss}, If[Random[] < .5, Join[Table[g, {#}], Table[0, {180 - #}]] & /@ nl, Join[Table[0, {#}], Table[g, {180 - #}]] & /@ nl]]](HTMLFiles/index_67.gif)
![]()
![[Graphics:HTMLFiles/index_69.gif]](HTMLFiles/index_69.gif)
![]()
![Do[ nums = Table[Round[180 funcs[[k]]/π], {η, 0, 2 π - 2 π/360, 2 π/360}] ; mat = mat + newcut[nums], {k, 1, Length[funcs]}] ;](HTMLFiles/index_71.gif)
![]()
![[Graphics:HTMLFiles/index_73.gif]](HTMLFiles/index_73.gif)
![]()
![]()
![earthColor[x_] := If[x <= .25, ConnectRGBColor[{0, 0, 0}, {0, 0, 1}, x/.25], If[x <= .65 ... 75) (x - .75)], ConnectRGBColor[{.90, .5, .15}, {.90, .5, .15} * 0.1, 1/(1 - .875) (x - .875)]]]]]](HTMLFiles/index_76.gif)
![]()
![]()
![]()
![]()
![[Graphics:HTMLFiles/index_81.gif]](HTMLFiles/index_81.gif)
![]()
![max = Max[mat] ; min = Min[mat] ; lvl = Map[(# - min)/(max - min) &, mat, {2}] ;](HTMLFiles/index_83.gif)
![]()
![]()
![]()
![]()
![pangea = Show[Graphics3D[ Join[ Table[{earthColor[lvl[[i + 1, 1]]], EdgeForm[], Polygon[{pt[i, ... orm[], Polygon[{pt[i, 180], pt[i + 1, 179], pt[i, 179]}]}, {i, 0, 359}]], Lighting -> False ]]](HTMLFiles/index_88.gif)
![[Graphics:HTMLFiles/index_89.gif]](HTMLFiles/index_89.gif)
![]()
Using my 3dmf-for-mathematica application package, the graphics object is converted to the QuickDraw3D metafile.
![]()
![]()
![]()
![]()
![]()
The QuickDraw3D Viewer for Windows is available from Apple.
![[Graphics:HTMLFiles/index_96.gif]](HTMLFiles/index_96.gif)
Unfortunately, the LiveGraphics3D doesn't work for the graphics output with large number of polygons.
Many years ago, I wrote an application Pangea for the MacOS classic. It works extremely faster than Mathematica because it's written by C++. The following screenshot shows the result of 5000 cutting steps generated about only 10 second.
![[Graphics:HTMLFiles/index_97.gif]](HTMLFiles/index_97.gif)
[1] Roman E. Maeder, "The Mathematica Programmer II", Academic Press, 1996
Converted by Mathematica (July 28, 2003)